Unlock Energy Efficiency. Understand. Save. Thrive.
At ConstantGraph, we believe that knowledge is power — especially when it comes to energy consumption. Our platform empowers you to take control of your home’s energy usage, leading to savings and a greener footprint.
Change the way you look at energy
- Energy Insights Made Simple
- Analyze by Day
Dive into daily energy patterns. Understand peak usage times and identify opportunities for optimization. - Device-Level Breakdown
Even non-smart devices reveal their secrets. Our energy disaggregation technology uncovers which appliances are guzzling power. - Whole Home Energy Meter
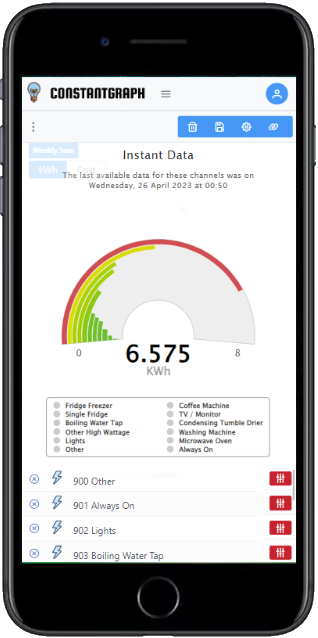
Get a holistic view of your energy consumption. Monitor trends and make informed decisions. - Visualize Your Ecosystem
- Graphs and Gauges
Visualize data effortlessly. From real-time power usage to historical trends, our intuitive graphs and gauges provide clarity. - Table Views
Dive deeper into specifics. See device-by-device breakdowns and compare performance. - Eco-Friendly Goals
Compare to historic trends. Witness your energy-saving efforts in action. - Share and Discover
- Create Dashboards
Curate your data. Share insights with family, friends, or the community. Collaborate and learn together. - Live Updates
Get up-to-the-minute data steamed live to your monitoring gauges and charts. - Embed Everywhere
Seamlessly integrate your dashboards into other home automation tools. Enhance situational awareness and stay informed.
Join the ConstantGraph Community
Whether you’re a seasoned SmartThings user or just starting your home automation journey, ConstantGraph is your ally. Sign up today and unlock a world of energy efficiency, visualization, and discoverability.
Read the reviews
- I've been using this website for a while now, and it's been a game-changer. The user-friendly interface and powerful tools have made managing my data easier than ever. Highly recommended for anyone looking to better understand their home automation set up.
Farouk - I manage a lot of rental properties so it's essential that I keep a constant eye on them. Using the powerful dashboards ConstantGraph helps me summarize the data in an easy to read format.
Premium user - This is a brilliant concept. I've only just started to look at it, but I'm very impressed!
Matt
ConstantGraph: Where data meets insight
