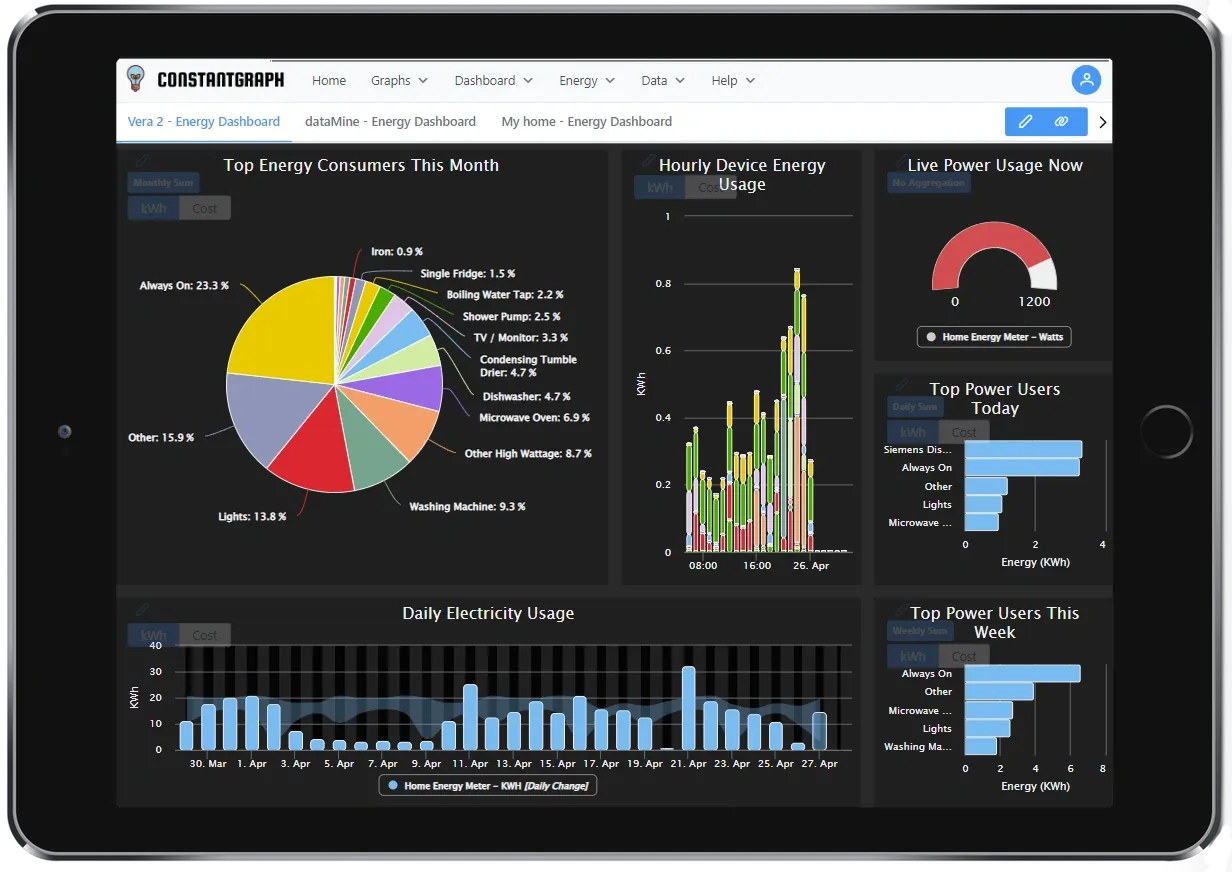
The Dashboard displays any graphs that have been saved from the Graphs menu. To create a dashboard use the dashboard builder . There are three views available:
Carousel view
In the carousel view graphs are shown one at a time. To view the next or previous graph click on the icons either side of the graph. If no graphs are shown then go to the Graphs menu to create one and save it.
The currently displayed graph can be edited by clicking the pencil icon in the top corner. This will take you back to the Graphs menu for editing.
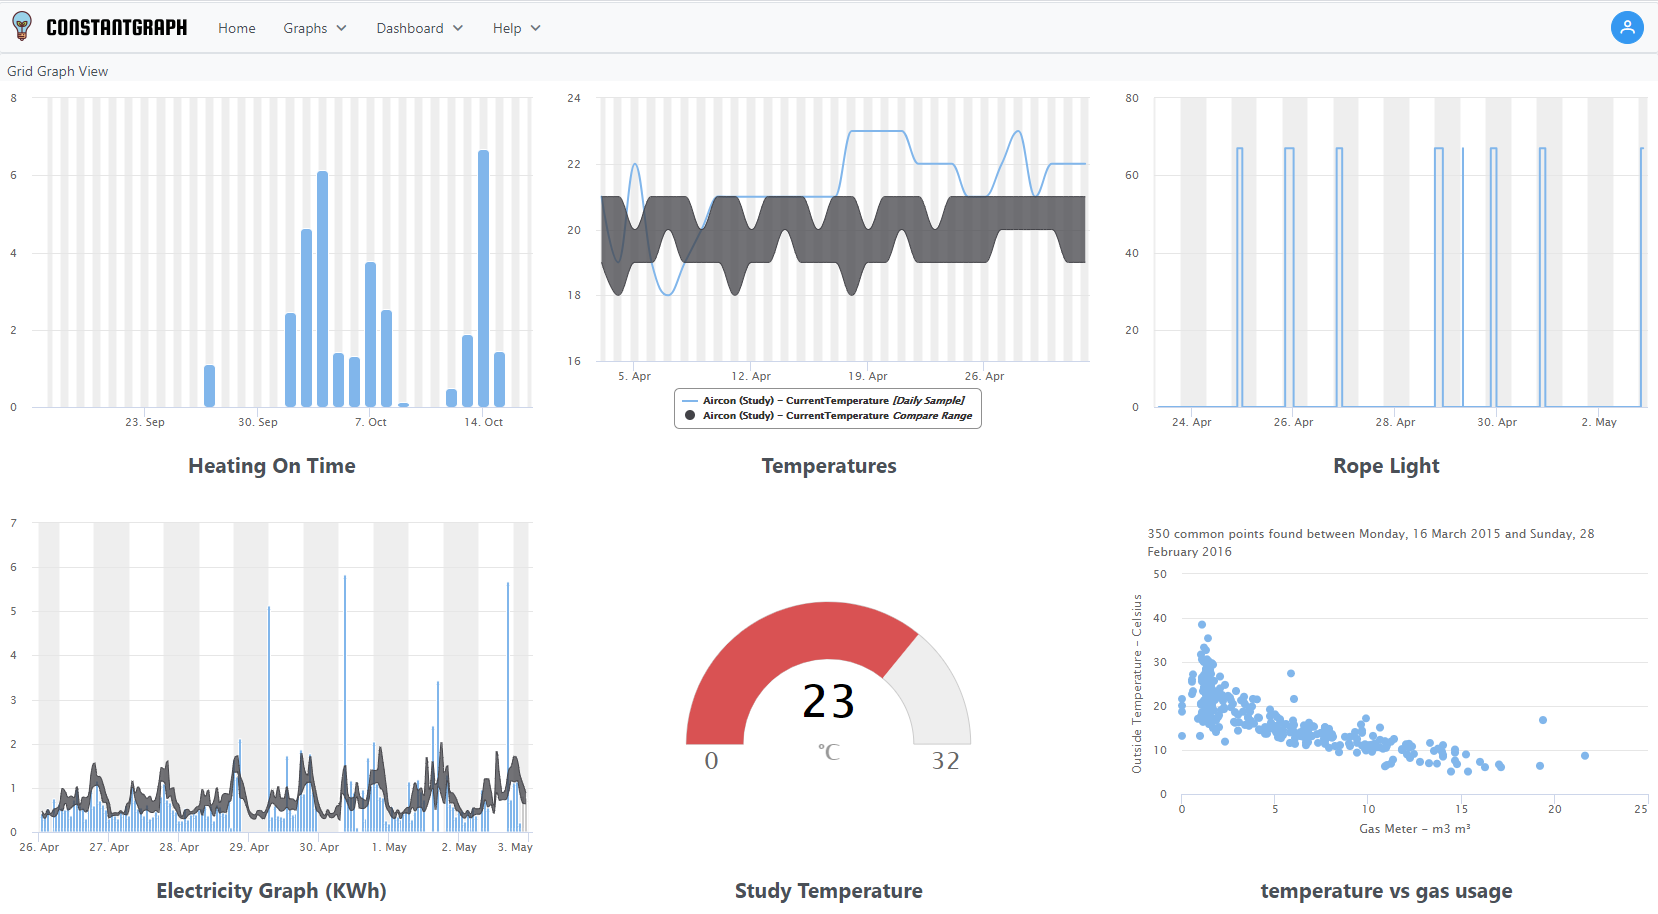
Grid view
The grid view displays a grid of graphs. The size of the grid depends on your screen size and can show 1 to 3 columns.
It is not possible to select which graph you want to edit from this view so editing is disabled. To select a graph to edit, go back to the carousel view.
The grid view is ideal to see a quick overview of your system status.
My Dashboards
The My Dashboards view shows your personalised dashboard. Dashboards can be configured to contain any graphs that you have previously defined and with a number of templates.