Energy disaggregation is the process of taking data from a single home energy monitoring device and analysing the signal to identify the energy usage of all of the individual connected devices. It's also known as Non-Intrusive Load Monitoring (NILM) and allows users to get a deep understanding of their energy needs at a device level with relatively modest equipment.
What can energy disaggregation do?
The energy disaggregation feature within ConstantGraph will create new data channels for each of the detected devices which can then be graphed using the various charting features:
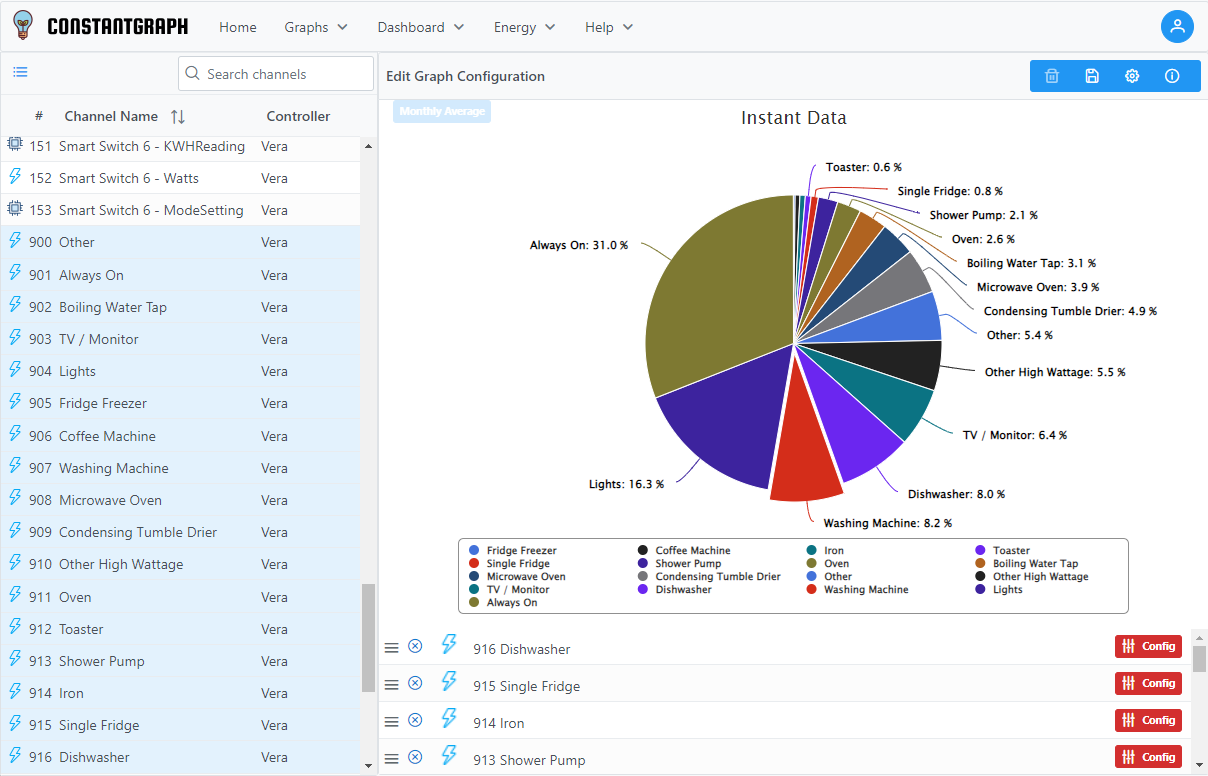
Example of energy disaggregation showing how each device contributes to daily energy usage
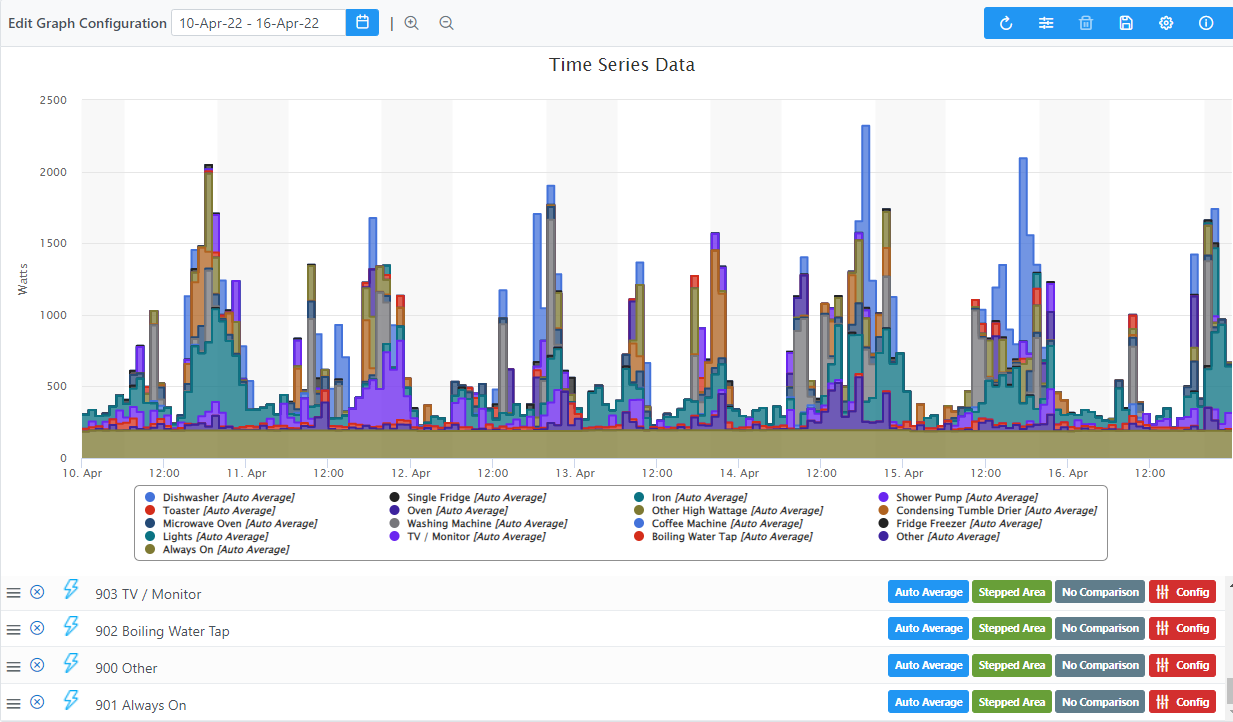
Example of energy disaggregation showing how the usage by hour of each identified device
How do you set it up?
The first step is to ensure you have a device that is monitoring your whole home energy usage sampling at around once every 5 seconds. This is a relatively high sampling rate for many home automation products but is needed to identify the detailed shapes of the energy profile (a suitable device would be the Aeotec Home Energy Meter). It should be configured to give 5 second readings for wattage but readings for current and voltage can be less frequent (e.g. once per minute) to reduce the traffic on your network. To log data at this rate within ConstantGraph you will need to use the Premium subscription which allows continuous logging of data and extended storage times.
In your ConstantGraph Plug-in make sure you have selected the device that is monitoring under the Devices tab and selected Log Continuously on the ConstantGraph tab. You will need to collect at least 1 entire day of data at around 5 second intervals before you can enable disaggregation.
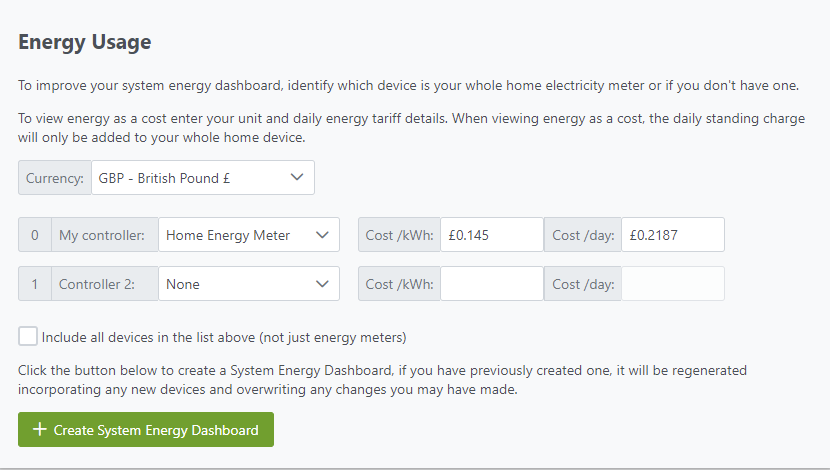
Log into your ConstantGraph account and go to the account settings page. Under Energy Usage make sure you have selected the device that will provide your whole home energy data
Then check to make sure that the channel has logged enough data. A tick (check) mark will be shown if enough data samples were collected for the previous day, otherwise a triangle will show that the channel is not suitable for disaggregation - hover over the triangle to see the reason why. If the channel is ready to start disaggregation, switch it on using the switch to the right.
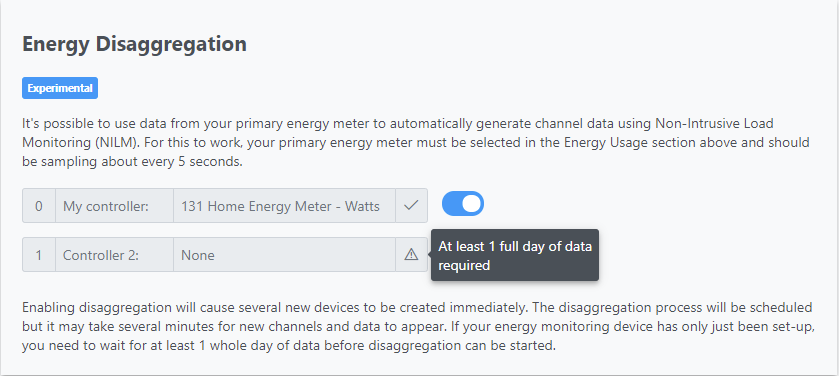
This will cause a number of devices to be created immediately in the following categories
- 1991 - Always On
- 1992 - Home entertainment
- 1993 - Fridges and freezers
- 1994 - Laundry and dishwashing
- 1995 - Lighting
- 1996 - Cooking
- 1997 - Small appliances
- 1998 - Heating and cooling
- 1999 - Other
Following that channels will be created with the data as the disaggregation calculations are made. The calculations use statistical techniques that are computationally expensive and may take several minutes to several hours to run. Once up and running, the calculations will be done overnight for the previous day.
A note on energy monitoring devices
Not all energy monitoring devices are capable of sampling at the rate required for disaggregation to work correctly. An example of one that works well is the Aeotec Home Energy Meter (gen 5) (HEM).
To get the best out of this device, it will need to be configured to sample at a high fequency. Exactly how this is done depends on your controller but the following parameters show an example of what could work well. Note that setting the sampling frequency too high may overwhem your Z-wave network, so experiment with what works for you.
- Set parameter 101 to 258 (Report 1 is watts for clamp 1)
- Set parameter 102 to 67589 (Report 2 is KWh and Voltage for clamp 1)
- Set parameter 103 to 0 (Report 3 is nothing)
- Set parameter 111 to 5 (Report 1 interval is 5 seconds)
- Set parameter 112 to 60 (Report 2 interval is 60 seconds)