ConstantGraph is a tool to log data from your home automation or similar system, aggregate, and visualise via a set of configurable graphs. Create graphs to compare energy usage from day-to-day or month-to-month. See whether your devices are operating within their normal range and compare using a range of simple-to-configure graph types and dashboards.
The powerful disaggregation feature allows data from a single Home Energy Monitor to be disaggregated (separated) into the energy for all of the individual devices in a home allowing the identification of high energy consuming devices and therefore cost savings to be made with energy efficiency. Data is added via the API, the ConstantGraph Plug-in available on the Vera platform or via the SmartThings integration. ConstantGraph provides the ability to:
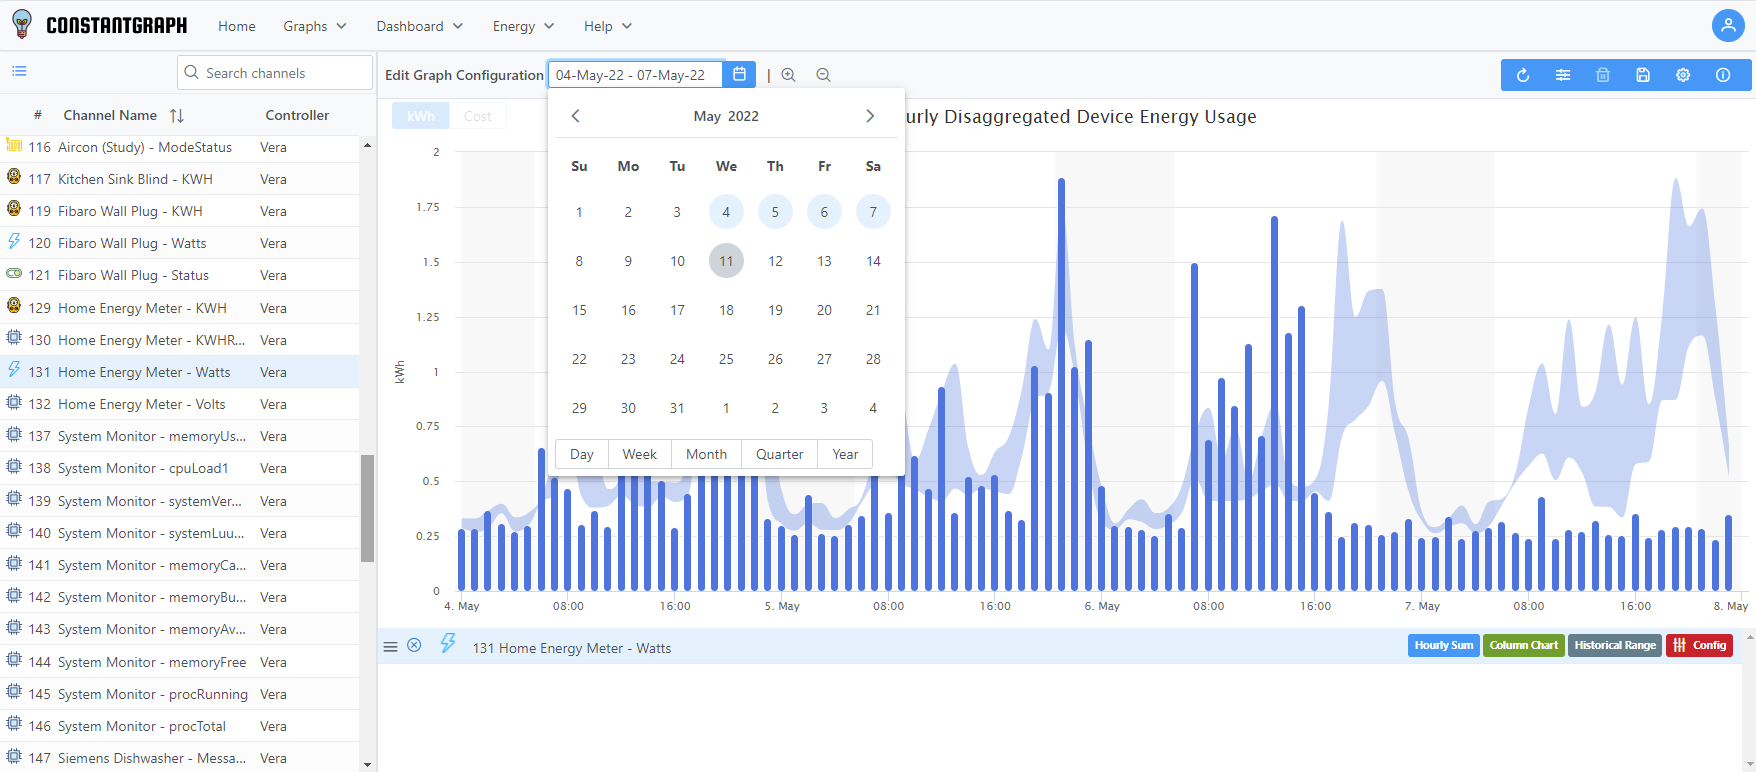
- Ability to aggregate data by hour, day, week and month
- Aggregation functions of sample, difference, sum, weighted average, minimum, maximum, on-duration, on-count and sample count
- Ability to disaggregate a single Home Energy Meter waveform into individual devices
- API's for data collection, channel definitions and graph configuration UI optimised to web and mobile
- Ability to import historical data (Historical Analysis subscription)
- Ability to define and save graphs of multiple types and channels Comparison against trends
- Sign-up and register for free or contact us at contact@constantgraph.com .